
MUSO is proud to be a major contributor to the EU IPO's latest report on piracy consumption in the EU, which shows that Europeans are consuming more pirated TV shows and live sports.
The report titled "EU trends in the digital copyright infringement in the European Union" was compiled using data from MUSO together with Eurostat (the statistical office of the EU), European Audiovisual Observatory and EUIPO’s IP Perception study. The report shows a holistic view of piracy trends in the EU across consumption, demographics and key drivers and indicates that the downward trend in piracy of previous years has been reversed.
Below is published an excerpt from the report.
MUSO provided the EUIPO with data on access to pirated films, TV and music from January 2017 to
December 2022 in all 27 EU Member States and the UK. Moreover, for 2021 and 2022, the dataset
includes pirated accesses to publications and software.
MUSO's figures represent absolute ‘activity’ values: visits to piracy sites that represent individual
accesses that could be associated with the consumption of a creative work. This ‘activity’ is used as
the basic data unit in this report. Specifically, the consumption of pirated digital content is defined as
the average number of ‘activities’ per internet user per month in each country and period.
The data is broken down into the following categories:
• geographical location: the country of residence of the consumer of copyright-infringing content,
for the 27 Member States of the EU and the UK;
• access method: streaming, torrenting (public and private), downloading and stream ripping;
• type of content: music, films, TV, software and publications;
• genre: Films & TV Shows, Anime, Live Broadcast, Live Sports, Music, Web Fiction, Sheet
Music, Publishing, Educational, Audiobooks, Manga, Books, Magazines & Newspapers,
Software, Games, Application Add-on, Mobile Software, Application Software. See Annex A of the EUIPO report for additional information on these subcategories.
• physical platform: mobile device or computer/desktop.
• traffic source that indicates how users reach pirated content: direct, search, referral, social,
mail, display ads. See Annex A of the EUIPO report for additional information on these sub-categories.
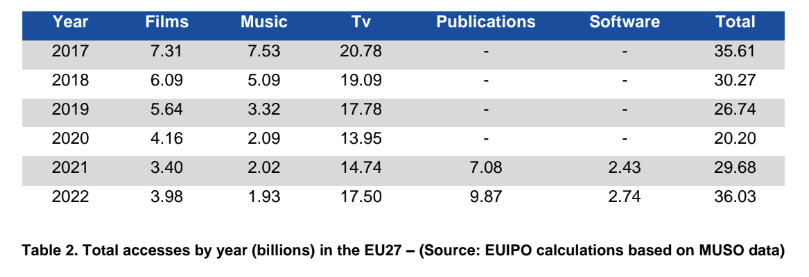
Table 2. Total accesses by year (billions) in the EU27 – (Source: EUIPO calculations based on MUSO data)
In this study, the piracy activity by country and year or month is presented per capita. Specifically,
this value has been calculated by dividing the activity figure by the total number of internet users per
country for a given year, obtained from Eurostat (see below).
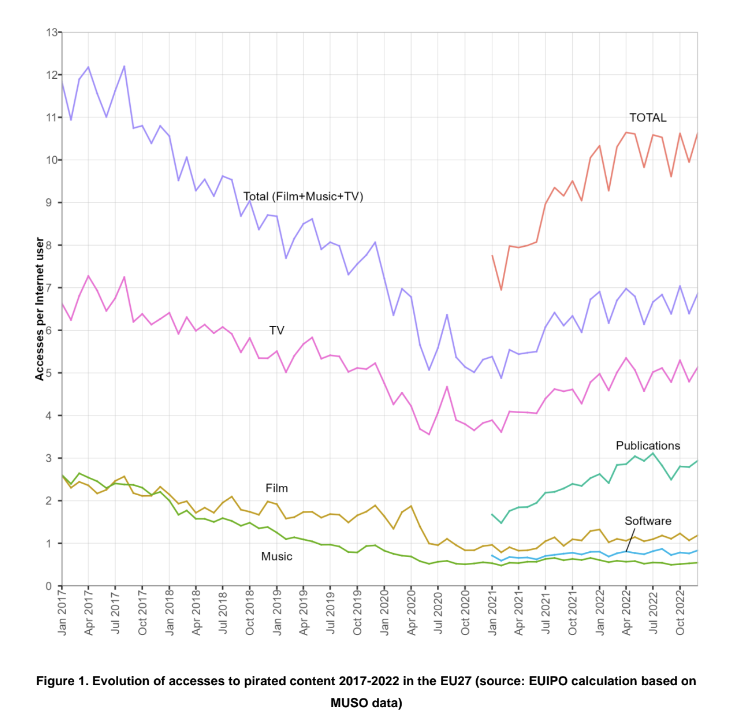
Figure 1 shows the evolution of accesses per capita for all the EU Member States. Until the end of
2020, there was a downward trend, which has since reversed due to a surge in pirated accesses to
TV content, affecting not just TV shows but also films. The data indicates a stabilisation in music
accesses at approximately one fifth of the levels recorded in 2017. This change in trend occurred
across all the EU Member States (see annexes). Moreover, the chart shows pirated accesses to publications and software. While software piracy has remained stable, pirated access to publications nearly doubled during this period, although the trend appears to be stabilising.
Click here to download the full report on the EUIPO website